

What Is Crypto Death Cross and Why Should You Know About It?
The crypto market has continued to decline since the beginning of 2018. The market has now lost over 80 percent of its value, with most investors now showing no interest in the market. But what is the crypto death cross, and why should you know about it?
What is a Death Cross?
A death cross is an indicator that predicts a coming decrease in the stock’s price. This bearish phenomenon occurs when the 50-day moving average crosses over the 200-day moving average. It’s called the “death cross” since it marks a change in trend fro m bullish to bearish. The death cross is one of the famous technical analysis techniques traders use to predict the future direction of financial assets.
The death cross owes its name to the x-shape that forms when the 50-day and the 200-day moving averages cross. While this is not always the case, for a death cross to occur, you will notice a drop in the 50-day moving averages over some time.
Traders use the death cross forecasting technique to decide whether to buy or sell financial assets moving higher or lower. When the stock price of a specific financial aid is higher than the trade price, it indicates the stock price is moving up. But when the stock price of a particular financial asset is lower than the trade price, it suggests the stock price is moving down.
Understanding Bitcoin Death Cross
According to Bloomberg and other sources, bitcoin has seen some fall since 2018. During the past few months, it has formed a death cross. What does this mean? Bitcoin’s 50-day moving average price has fallen below the 200-day one, spiking some worry among investors.
Even so, considering that the 200-day moving average is still rising, there’s reason to believe that this signal might not prove bearish in the end. This trend had happened before in March 2020 but ended up in a golden cross, hence more gain to investors.
For instance, let’s picture the stock price of IBM improving by 3% during a five-day trading period. During the same period, the cost of the S&P 500 stays relatively at its previous level. Then the stock price of IBM will have a higher probability of movement up during the next five-day trading period or a death cross.
Let’s look at the death cross on the S&P 500 in 2018, as represented in the chart below. The 50-day moving average crossed over the 200-day moving average, on a downward curve, resulting in a death cross.
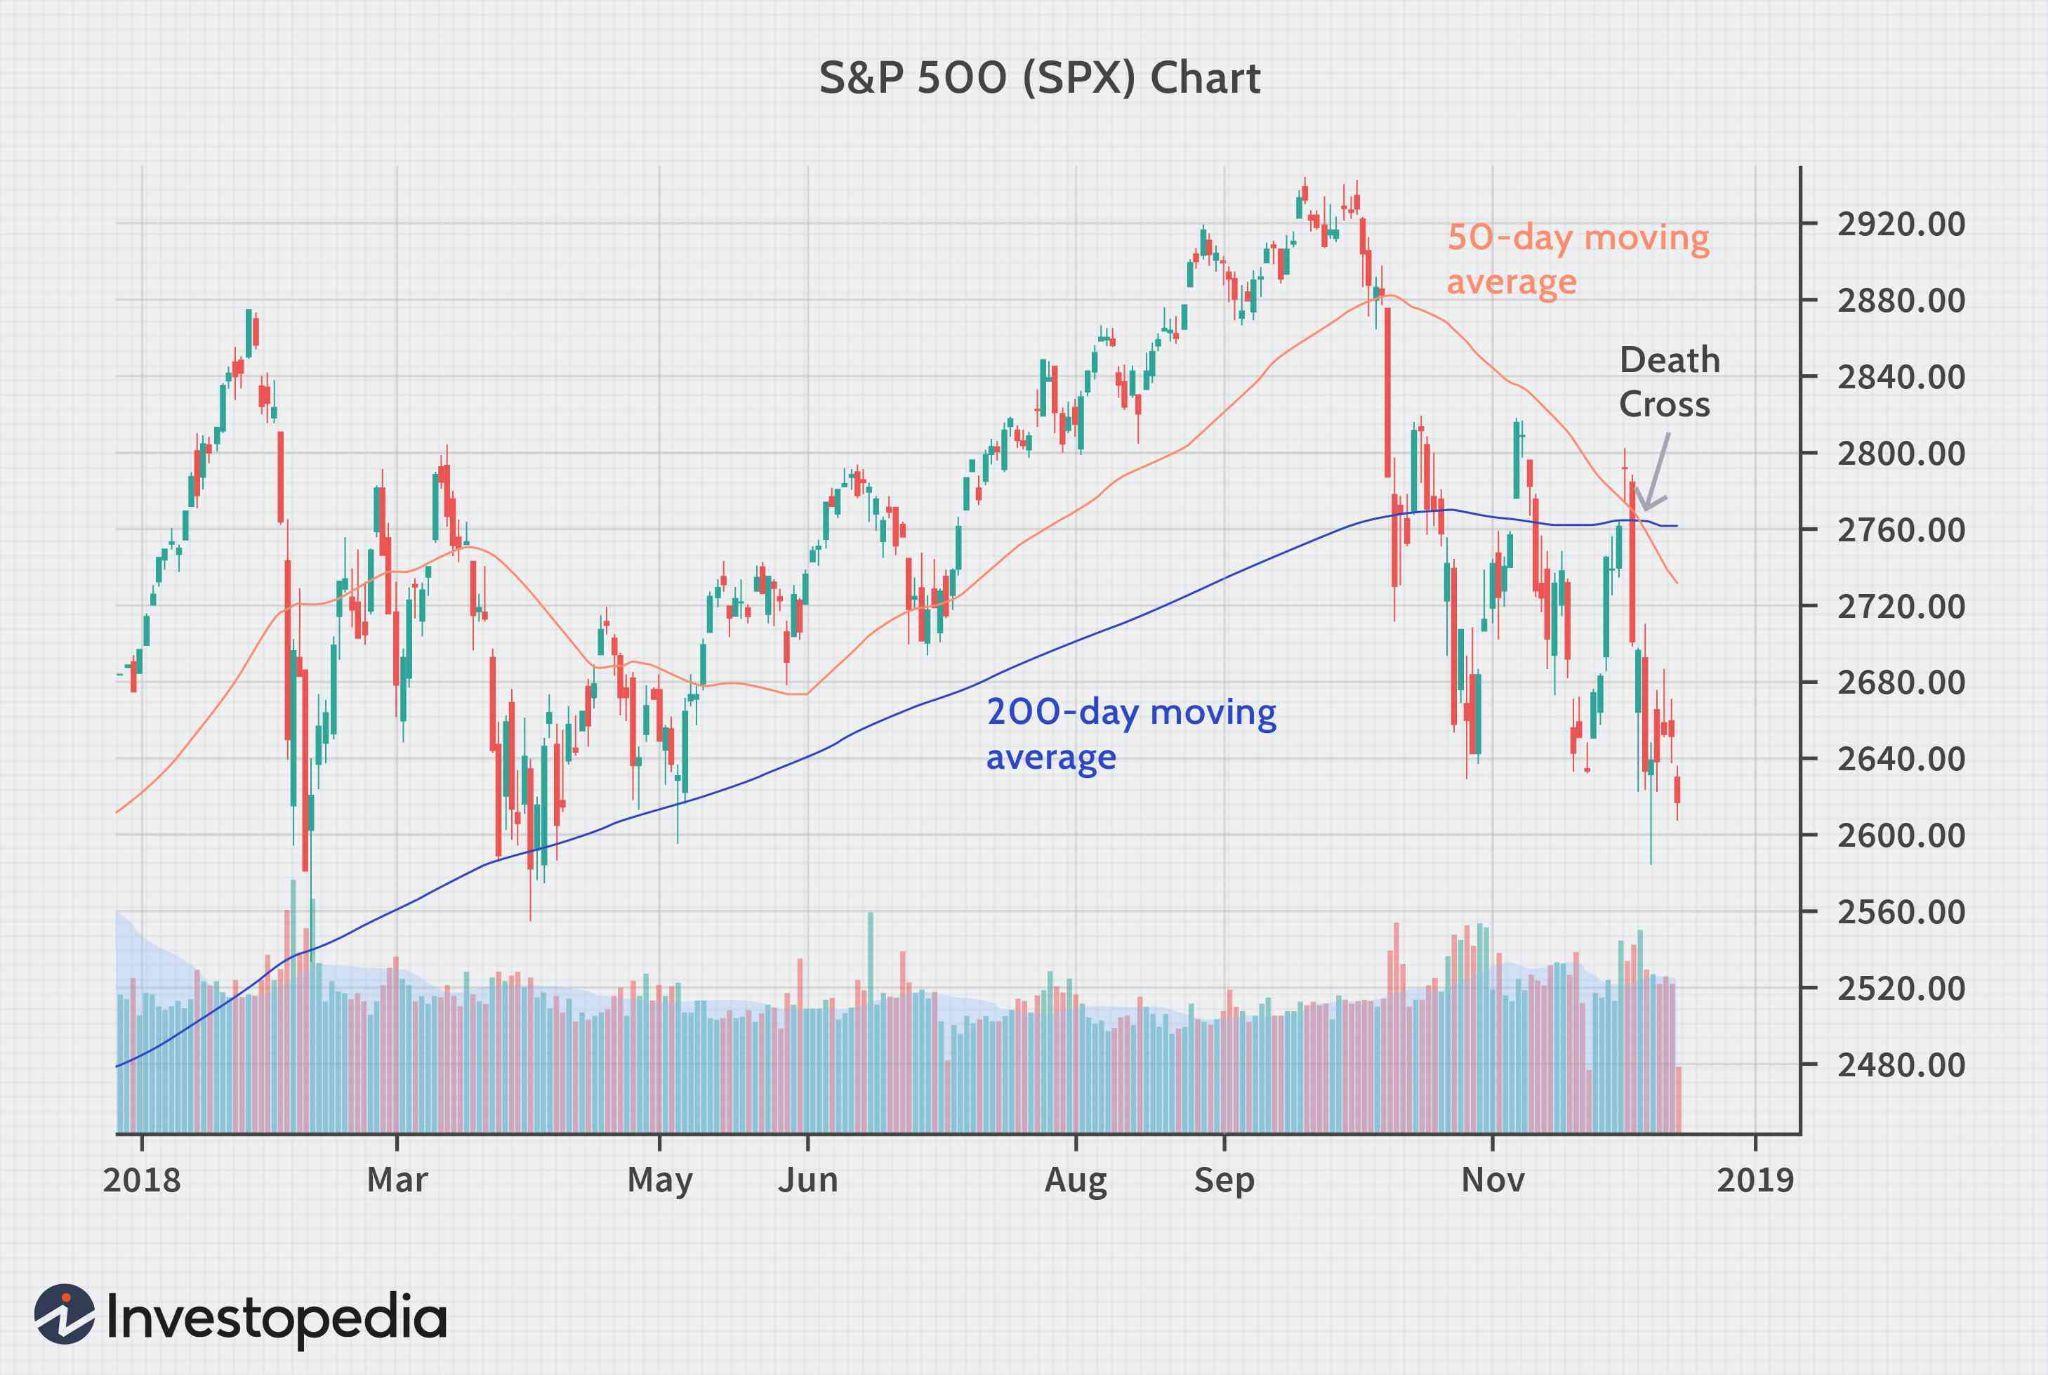
Is it a safe parameter to use to base your investment decisions? The death cross was an instrumental predictor that enabled traders to evade high losses, up to 90% based on past bear markets. An increase in volume is a common prelude to a death cross. This signifies the beginning of a new bear market.
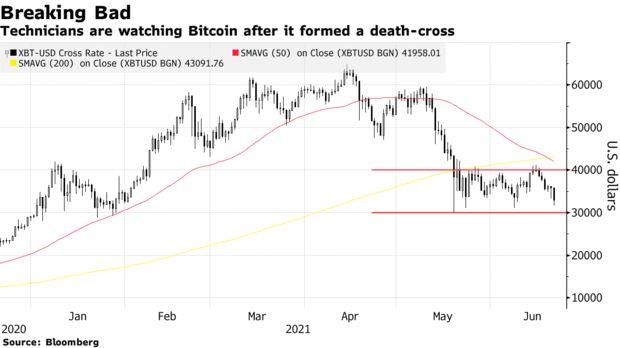
Source: Bloomberg
With the current trend in bitcoin, it is hard to tell what will happen in the next few months. There is hope that the market will rise again, but time will reveal what happens.
Conclusion
While not always indicative of a bear market, the death cross carries more weight to investors concerned about locking in gains before a new bear market gets underway. Mixed with other analytical techniques, you stand better chances of making the best investment decisions.

You must be logged in to post a comment.